Field Notes Sports data
Sports data
Slytrunk turns live feeds into something a fan can read while it still matters.
A fan following a game has usually seen the play before the app has. The score, the fantasy points, the clip: if any of it arrives a beat late, the app is showing a recap. Sport set our bar for speed because sport doesn't wait. The feed keeps coming whether or not the build is ready, and nobody pauses a fourth quarter for a deploy.
Scores, stats, fantasy, video. We've spent years building the systems that take a feed in, make sense of it and get it onto a screen before it goes stale.
Every kind of feed
Sport taught us speed. Plenty of other feeds needed it too.
Entertainment catalogs, news channels, the weather. We built AOL's weather site, weather.aol.com, from scratch, alongside two other AOL lifestyle sites: Mandatory for men and PawNation for pet owners. At Xumo we joined the server team, doing feature work and bug fixes on the pipeline that takes in partner feeds of metadata and video, transcodes them and exports Xumo's catalog back out to its distribution partners.
The payload changes and the problem stays the same. The data comes from someone else's system on someone else's schedule, and it has to be cleaned, trusted and on screen before it's old.
Personal data · NFL Fantasy
Everyone is watching a different game.
A score is the same for every fan. A fantasy score is different for each one. Every NFL Fantasy player has their own roster, their own league and their own matchup, and all of it moves the moment a play is official. We built and ran that platform end to end: feed parsing, business logic, data, and the API under every client. That means one touchdown fans out into [N] personal scoreboards in [time].
Holding that much per-fan data is hard enough on a quiet Tuesday. Keeping it correct and fast at 1pm Eastern on a Sunday, when every player hits refresh at once, is the actual job.
Data analysis · Sly Paddock, from Slytrunk Labs
Every lap, broken down to the corner and explained in plain language.
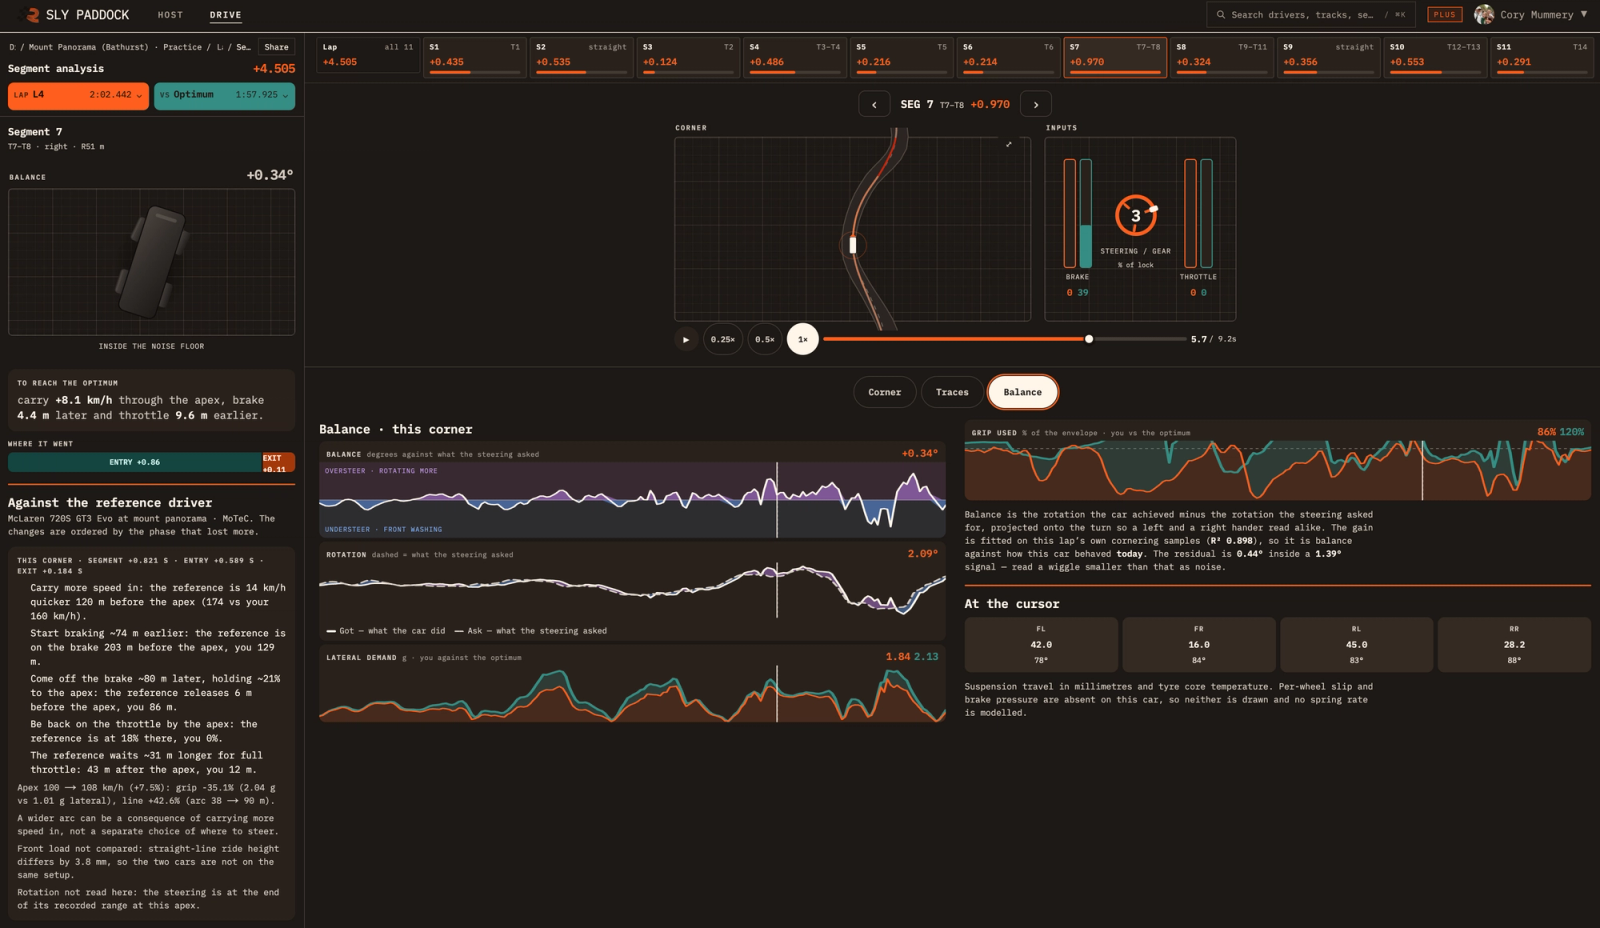
Sly Paddock is our own sim racing platform. Results arrive from the game the moment a session ends, and every lap is scored against a reference and placed in one of seven pace tiers. In Drive, each lap is split into segments and timed against an optimum lap. Pick a corner and you get the brake, steering and throttle replayed on the racing line, the grip used against the car's envelope, and suspension travel and tyre temperature at each wheel.
Balance is fitted on the lap's own cornering samples, and a wiggle inside the noise floor is labelled as noise. To reach the optimum, the screen tells the driver to carry 11.8 km/h more through the apex, brake 5.6 m later and get on the throttle 11.3 m earlier. Against a reference driver, it orders the changes by the phase that lost more time. Where a car doesn't record a channel, such as per-wheel slip or brake pressure, the screen says so and draws nothing.
Live odds · Hundo
The line goes dark right when the game gets good.
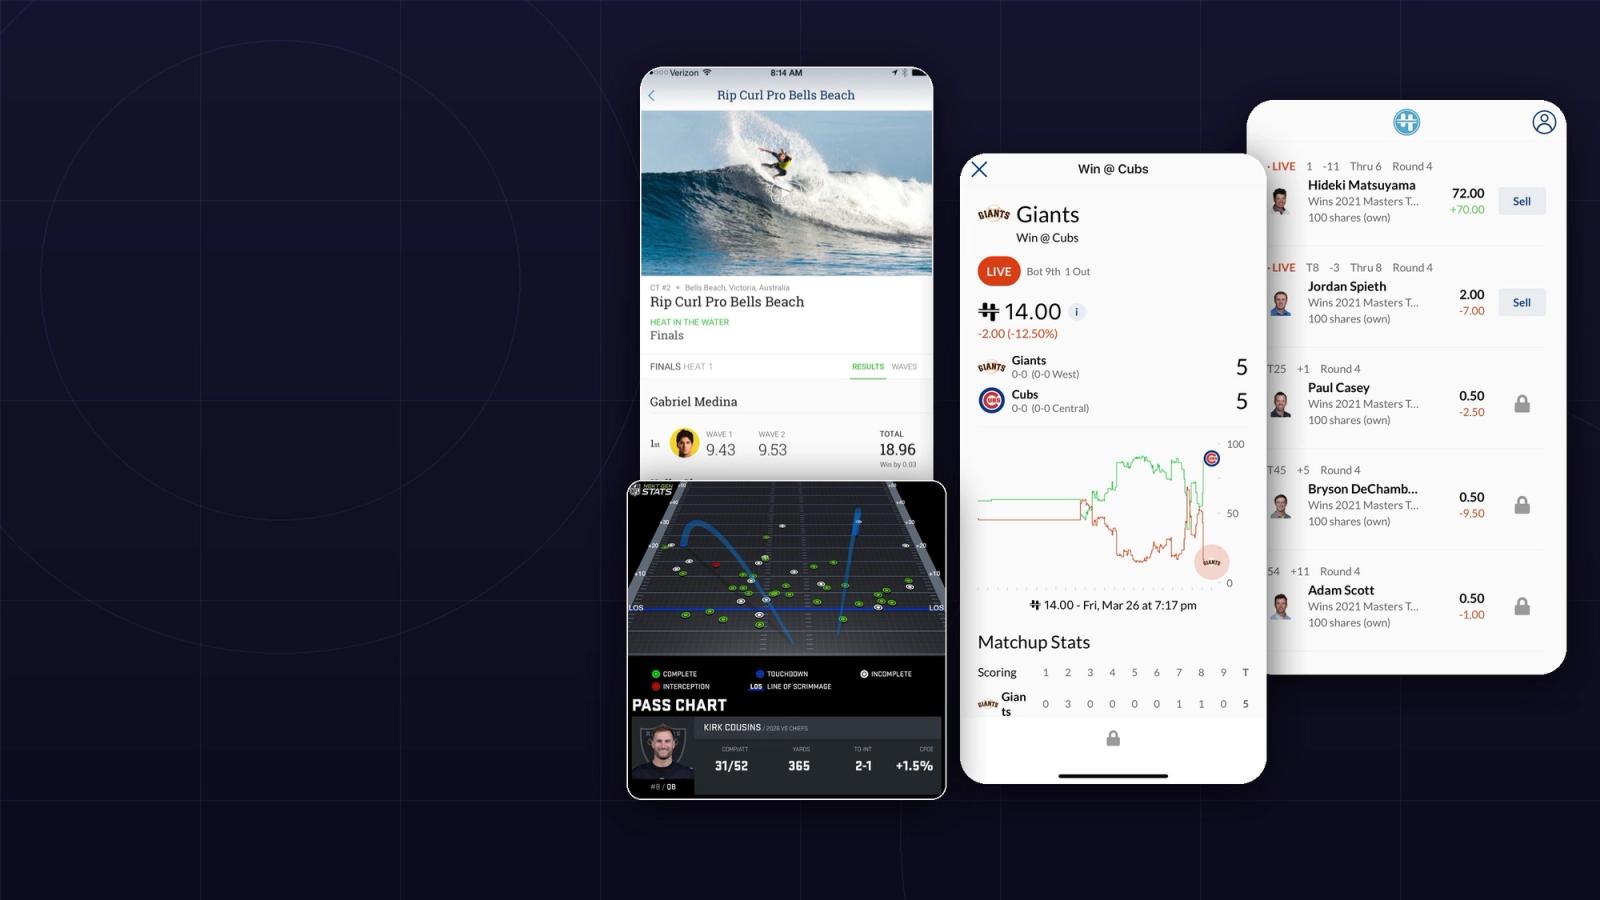
Hundo was a sports-betting exchange. We built its backend, which took in pre-game and in-game moneylines from several providers across several sports. A moneyline doesn't only move. It also locks. When an NFL team gets into the red zone or a corner kick is about to be taken, sportsbooks stop taking action, and the line disappears at the moment fans most want to act on it.
So the backend tracked the state of every game and team while play was live, and the app showed it. When a line locked, the buy and sell buttons turned into a lock icon. When the line reopened, they came back.
Visualization · NFL Next Gen Stats
Every carry, drawn on the field.
Next Gen Stats records where every player is, how fast they're moving and how quickly they're speeding up, on every play. That adds up to millions of data points a game, and none of them mean anything to a fan until someone draws them. We work alongside the NFL's Next Gen Stats team. Among other things, we built the tool their editors use to do that drawing. An editor picks a player and a game, and the tool generates the chart (a carry chart, a route chart, a passing chart) ready for social or anywhere else the NFL wants to post it.
The editor decides which moment matters, and the tool does the drawing. That means a chart can go out while people are still arguing about the game.
Contact
Got a feed that can't keep up?
Bring it, and the people who get paged when it falls behind.